Blog Entry 4: Design of Experiment
- yuhan21
- Jan 19, 2023
- 1 min read
Hi everyone! Happy New Year & welcome to my 4th blog entry! It has been a while since I had last updated, since my peers and I were having our mid-semester holiday :-). In this blog entry, I will be discussing about the topic of Design of Experiment (DOE) and what I have learnt about it. My learning experience was facilitated by both tutorial and practical sessions, and I will be documenting it in this blog entry. Read on to find out!
For this blog entry, I was tasked to complete a full factorial and fractional factorial analysis for a given case study on ESP Brightspace, followed by a learning reflection of my tutorial and practical sessions.
FULL FACTORIAL Data Analysis
Effect of single factors & their ranking
Factor A: Diameter of bowls to contain the corn, 10 cm and 15 cm
Factor B: Microwaving time, 4 minutes and 6 minutes
Factor C: Power setting of microwave, 75% and 100%
The most significant factor that affects the number of inedible "bullets" (un-popped popcorn kernels) remaining at the bottom of the bag of popcorn is factor C, followed by factor B, then factor A.
This is inferred from the gradients of each of the factor's linear graph, since a factor with a gradient of a higher magnitude translates to their higher significance in impact regarding the experimental results. These gradients can be obtained from the linear equations displayed on the graph.
Gradient of factor A: - 0.1475
Gradient of factor B: - 0.9475
Gradient of factor C: - 1.9525
It can then be observed the the gradients of the three factors are all negative. This tells us that for all three of the factors, a + (HIGH) value will result in a lower amount of bullets, and hence a higher yield of edible popcorn.
Interaction effects
(A x B)
At LOW B,
Average of LOW A = (0.74 + 3.12) / 2 = 1.93
Average of HIGH A = (3.35 + 0.95) / 2 = 2.15
Total effect of A = 2.15 - 1.93 = 0.22 (Increase)
At HIGH B,
Average of LOW A = (2.35 + 0.35) / 2 = 1.35
Average of HIGH A = (1.35 + 0.32) / 2 = 0.835
Total effect of A = 0.835 - 1.35 = - 0.515 (Decrease)

The gradient of both lines are different (one is + and the other is -). Therefore, there is a significant interaction between A and B.
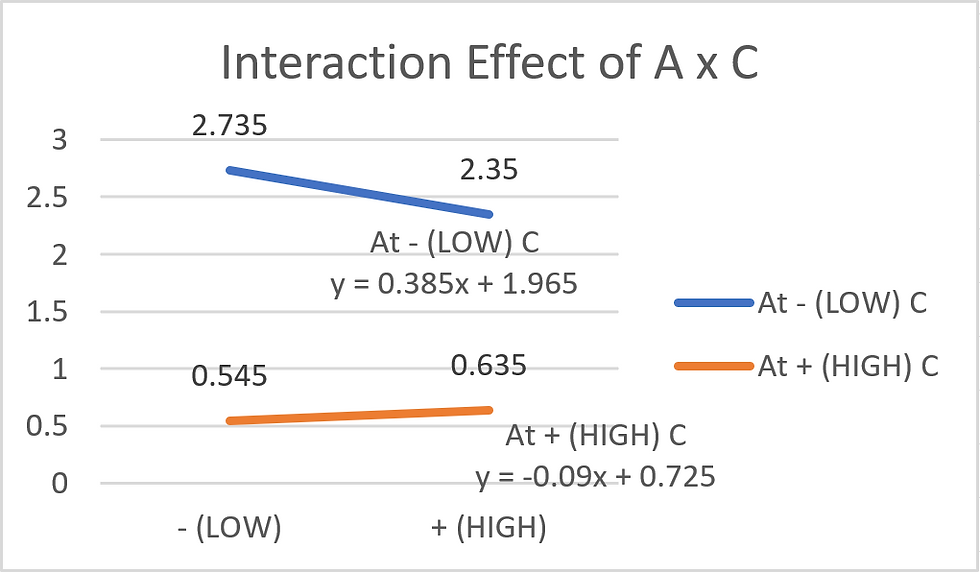
(A x C)
At LOW C,
Average of LOW A = (2.35 + 3.12) / 2 = 2.735
Average of HIGH A = (3.35 + 1.35) / 2 = 2.35
Total effect of A = 2.35 - 2.735 = - 0.385 (Decrease)
At HIGH C,
Average of LOW A = (0.74 + 0.35) / 2 = 0.545
Average of HIGH A = (0.95 + 0.32) / 2 = 0.635
Total effect of A = 0.635 - 0.545 = 0.09 (Increase)

The gradient of both lines are different (one is + and the other is -). Therefore, there is a significant interaction between A and C.
(B x C)
At LOW C,
Average of LOW B = (3.35 + 3.12) / 2 = 3.235
Average of HIGH B = (2.35 + 1.35) / 2 = 1.85
Total effect of B = 1.85 - 3.235 = - 1.385 (Decrease)
At HIGH C,
Average of LOW B = (0.74 + 0.95) / 2 = 0.845
Average of HIGH B = (0.32 + 0.35) / 2 = 0.335
Total effect of B = 0.335 - 0.845 = - 0.51 (Decrease)

The gradient of both lines are different and have different values. Therefore there is an interaction between B and C, but the interaction is small. If both lines are parallel, then there is NO interaction.
Tables & Graphs + Excel file!
Tables


Graphs

Conclusion...
Factor C (Power setting of the microwave) has the most significant impact on the number of bullets. Factor B (Microwaving time) has a moderate impact, while factor A (diameter of the bowl to contain the corn) has the least significant impact on the number of bullets.
However, despite the difference of each factor's impact on the number of bullets, it is concluded that an increase in each factor will result in the decrease of the number of bullets, and hence the increase of popcorn yield.
Hence, to achieve an optimal popcorn yield, all the factors should be on the + (HIGH) side.
In addition, factors A and B have a significant interaction with each other. This is the same for factors A and C. However, factors B and C has an interaction of lesser significance between them.
FRACTIONAL FACTORIAL Data Analysis
Effect of single factors & their ranking
Factor A: Diameter of bowls to contain the corn, 10 cm and 15 cm
Factor B: Microwaving time, 4 minutes and 6 minutes
Factor C: Power setting of microwave, 75% and 100%
To start with the fractional factorial data analysis, 4 experimental runs with an equal number of - (LOW) and + (HIGH) data for each factor are to be selected. This makes the data orthogonal and have a balanced design, resulting in good statistical properties. With that, runs 2, 3, 4, and 5 were selected.
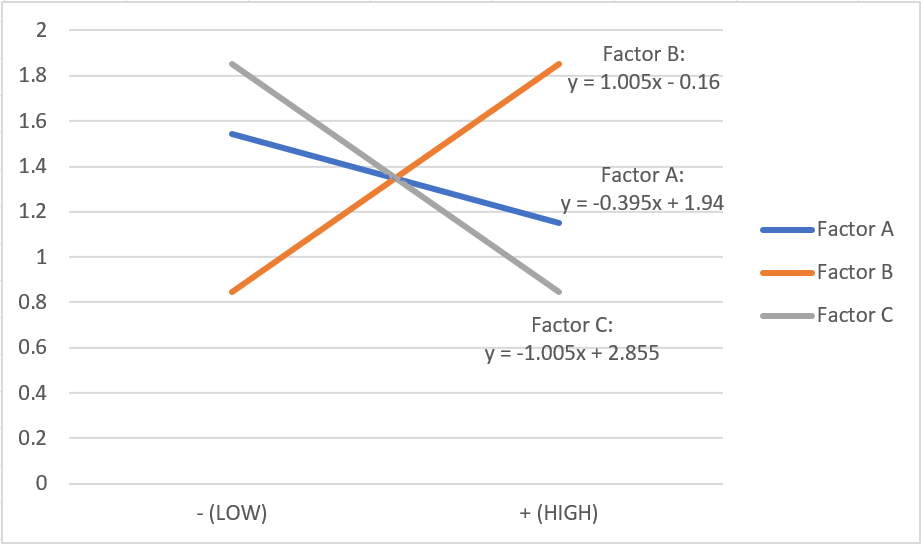
The most significant factors that affect the number of inedible "bullets" (un-popped popcorn kernels) remaining at the bottom of the bag of popcorn are factor B and factor C, followed by factor A.
This is inferred from the gradients of each of the factor's linear graph, since a factor with a gradient of a higher magnitude translates to their higher significance in impact regarding the experimental results. These gradients can be obtained from the linear equations displayed on the graph.
Gradient of factor A: - 0.395
Gradient of factor B: 1.005
Gradient of factor C: - 1.005
The gradients of factor B and factor C have the same magnitude, and hence factor B and factor C has the same significance in affecting the number of bullets. Since the gradient of factor A is the smallest, factor A has the lowest level of significance.
It can then be observed the the gradients of factor A and C are negative. This tells us that a + (HIGH) value will result in a lower amount of bullets, and hence a higher yield of edible popcorn.
On the other hand, the gradient of factor B is positive. This tells us that a + (HIGH) value will result in a higher amount of bullets, and hence a lower yield of edible popcorn.
Tables & Graphs + Excel file!
Tables


Graphs

The same excel file was used for the full factorial data analysis! Nevertheless, here is the file:
Conclusion...
Factor B (Microwaving time) and factor C (Power setting of the microwave) has the most significant impact on the number of bullets, while Factor A (Diameter of the bowl to contain the corn) has the least significant impact on the number of bullets.
It can then be observed that an increase in factor A and C will result in a lower amount of bullets, and hence a higher yield of edible popcorn.
On the other hand, an increase in factor B will result in a higher amount of bullets, and hence a lower yield of edible popcorn.
Hence, to achieve an optimal popcorn yield, factor A and C should be on the + (HIGH) side, while factor B should be on the - (LOW) side. This contradicts the conclusion of the full factorial data analysis, where all factors should be on the + (HIGH) side to achieve a higher yield of edible popcorn.
This is because fractional factorial data analysis is ‘less than full’. It is more efficient and resource-effective, but there is a risk of missing information. Fewer than all possible treatments are chosen to still provide sufficient information to determine the factor effect.
Learning Reflection
Tutorial
During the tutorial session, my peers and I learnt about DOE for the first time. We understood how every experiment has their experimental parameters and runs planned through DOE. One such example of that is our experiment on the parameters affecting the leaching of coffee solubles in CP5202, Lab and Process Skills 2. Hence, despite DOE being a new topic, we understood it pretty quickly as it was correlated with an experiment that we had completed before.
To carry out DOE, Microsoft Excel had to be used to input the values, parameters, and such to create the required graphs. This did not pose great difficulty to us, as we had been trained in using Microsoft Excel multiple times. One of which was the Excel Day, where we were trained to use the many different functions to carry out different tasks in Microsoft Excel, in our first year of study.
Hence, we can observe and conclude that the skills and information that we have learnt before help and guide us greatly in our future studies. Without these skills, we would have struggled badly in understanding DOE.
Learning about DOE also helps us understand how we can plan an experiment for research regarding the varying of parameters. All along, I had thought that parameters were varied randomly to find the best experimental result. Without learning about DOE, I would never have known about the mechanism behind planning such experiments, or about how parameters should be varied so that an orthogonal balanced design of equal - (LOW) and + (HIGH) values of each parameter is done.
This newly gained knowledge of DOE will then greatly aid us in the future in designing experiments, especially during the prototyping of our CA2 product in the near future (My group's product is an automated door handle steriliser).
Practical
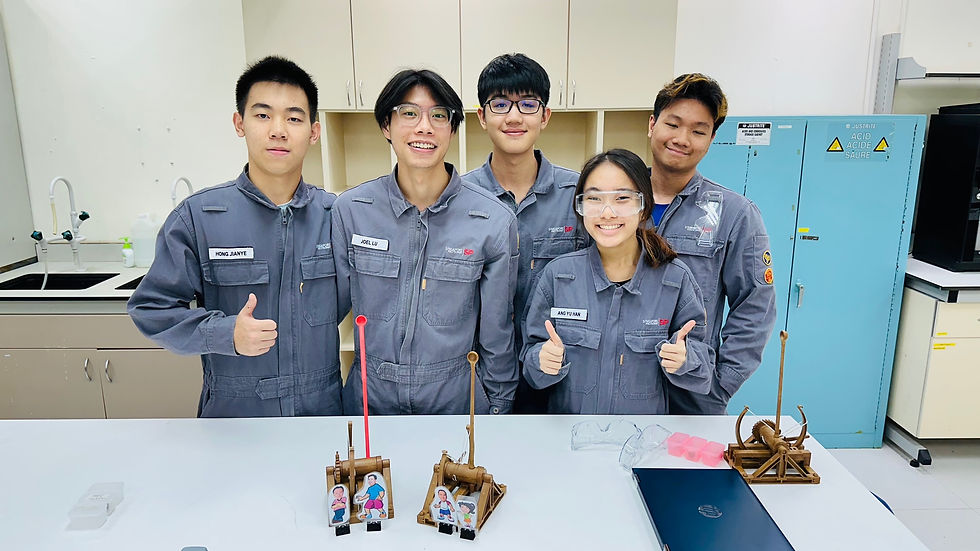
During the practical session, my peers and I were tasked to carry out an experiment. This experiment was about using a catapult and ball and noting down the distance of the ball travelled with the use of 3 different parameters at - (LOW) and + (HIGH) values. The 3 parameters are the weight of the ball, the length of the catapult arm, and the stop angle of the catapult arm. We conducted 8 runs with each run having a mix of - (LOW) and + (HIGH) parameters. Each run was replicated 8 times to produce an averaged value for each run, increasing the accuracy of the experimental results. After collecting these results, we carried out the steps in DOE to determine the order of the most significant factor in affecting the experimental results by plotting the required graphs.
Afterwards, we had a fun and interesting activity to spice up our practical session, as conducting the experiment 76 times for full and fractional factorial data analysis using the different parameters had tired and bored us out. The task of the activity was to knock out 4 standees of our lecturers that were placed at different locations. Each standee will have 2 actual tries, while the overall task will provide us with 3 trial tries. At first, my group was hopeless at winning, since we had struggled a fair bit in completing the experiment earlier. Our dejection led us to request being the last group to start on the activity. During our free time, we measured the distance between the catapult and the standees at their 4 respective locations and tested a mix of different parameters so that the required parameters to knock out each standee can be determined. We used our WhatsApp chat to record the parameters needed!

To our surprise, our group had won the activity, since we had knocked down all 4 standees with 2 remaining trial tries. To be honest, being the last group had in turn helped us, as we were able to devise a strategy to have a better go at the activity. This strategy was to use actual tries first for each standee, and to use trial tries afterwards if we end up not knocking the standee down. We knocked down the first 3 standees (Mr Ting, Dr Noel, Mr Chua) during our first try. For Ms Oh's standee, our first (actual) try failed. After adjusting our parameters quickly, we succeeded in our trial try and immediately completed the second and last actual try.
We tied with another group! The third group to start on the activity had also knocked down all 4 of the standees.


With this activity, we learnt not to give up too easily as our result of winning or losing is not predetermined, and can be changed according to our effort and planning. I am glad that we did not neglect the planning of the activity because we initially thought that we would have no chance at winning.
This marks the end of my blog entry. Thank you everyone for sticking until the end to read more about my experience in learning about DOE! Stay tuned for my next blog entry!


Comments